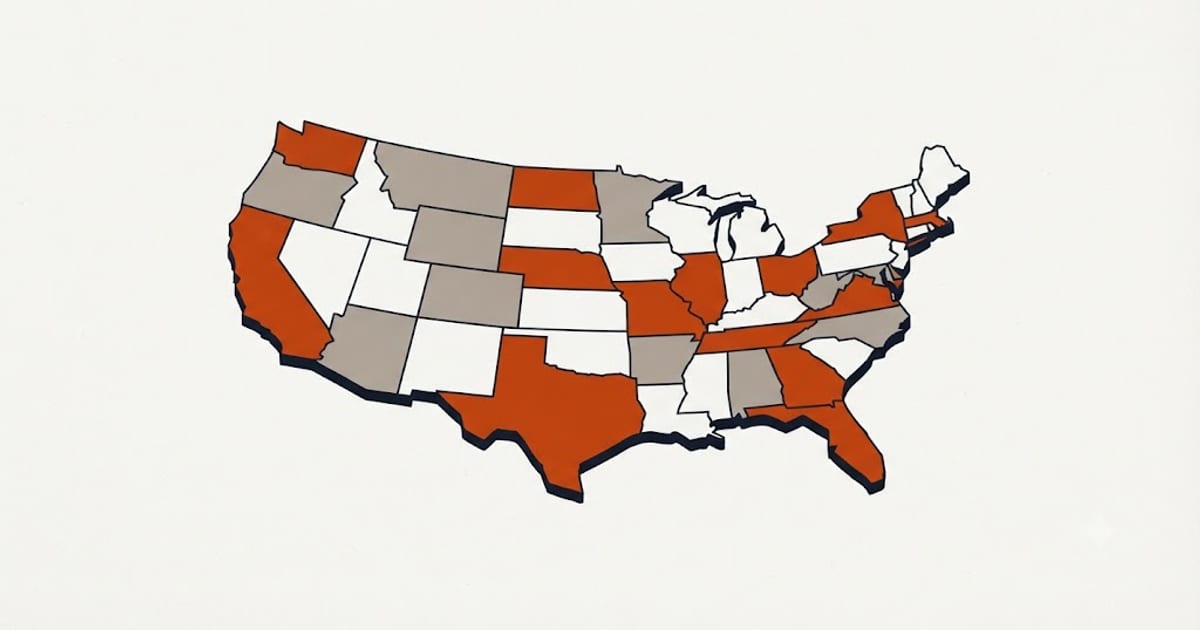
State-average roof cost is a number people search for and then cannot use, mostly because the published versions are bands somebody eyeballed. This one is built differently, and you can check every step of it.
How this table was built
Two inputs, both published.
The national price. Installed architectural asphalt with tear-off of one layer runs about $560 per square in 2026, inside a market range of roughly $380 to $900.
The labor share. About 60% of a re-roof is somebody's time. The other 40% is material, and a bundle of shingles does not get cheaper because it is nailed down in Mississippi.
So only the labor half is scaled, and it is scaled by one published ratio: the Bureau of Labor Statistics mean annual wage for roofers in that state, against the national mean of $58,140. That is the OEWS release for May 2025, SOC 47-2181. You can look up any row of the table below on the BLS site and check it.
All 51 states, 25 squares, tear-off included
Twenty-five squares is a common size for a 2,000 ft² single-story house at a moderate pitch. Each state links to a page where you can change the roof size.
| State | Roofers mean pay | Labor factor | Typical total | Bid range |
|---|---|---|---|---|
| Alabama | $47,860 | 0.823 | $12,515 | $8,492 – $20,113 |
| Alaska | $68,450 | 1.177 | $15,490 | $10,511 – $24,894 |
| Arizona | $50,600 | 0.87 | $12,911 | $8,761 – $20,749 |
| Arkansas | $45,780 | 0.787 | $12,214 | $8,288 – $19,630 |
| California | $67,420 | 1.16 | $15,341 | $10,410 – $24,655 |
| Colorado | $56,170 | 0.966 | $13,715 | $9,307 – $22,043 |
| Connecticut | $68,490 | 1.178 | $15,495 | $10,515 – $24,903 |
| Delaware | $55,280 | 0.951 | $13,587 | $9,220 – $21,836 |
| District of Columbia | $68,740 | 1.182 | $15,531 | $10,539 – $24,961 |
| Florida | $48,870 | 0.841 | $12,661 | $8,591 – $20,348 |
| Georgia | $48,440 | 0.833 | $12,599 | $8,549 – $20,248 |
| Hawaii | $61,430 | 1.057 | $14,475 | $9,823 – $23,264 |
| Idaho | $54,300 | 0.934 | $13,445 | $9,124 – $21,608 |
| Illinois | $77,650 | 1.336 | $16,819 | $11,413 – $27,030 |
| Indiana | $59,810 | 1.029 | $14,241 | $9,664 – $22,888 |
| Iowa | $52,070 | 0.896 | $13,123 | $8,905 – $21,091 |
| Kansas | $53,370 | 0.918 | $13,311 | $9,032 – $21,392 |
| Kentucky | $50,680 | 0.872 | $12,922 | $8,769 – $20,768 |
| Louisiana | $52,790 | 0.908 | $13,227 | $8,975 – $21,258 |
| Maine | $53,700 | 0.924 | $13,359 | $9,065 – $21,469 |
| Maryland | $61,640 | 1.06 | $14,506 | $9,843 – $23,313 |
| Massachusetts | $72,990 | 1.255 | $16,146 | $10,956 – $25,948 |
| Michigan | $61,450 | 1.057 | $14,478 | $9,825 – $23,269 |
| Minnesota | $72,920 | 1.254 | $16,135 | $10,949 – $25,932 |
| Mississippi | $45,280 | 0.779 | $12,142 | $8,239 – $19,514 |
| Missouri | $56,320 | 0.969 | $13,737 | $9,322 – $22,077 |
| Montana | $57,010 | 0.981 | $13,837 | $9,389 – $22,238 |
| Nebraska | $47,930 | 0.824 | $12,525 | $8,499 – $20,129 |
| Nevada | $57,460 | 0.988 | $13,902 | $9,433 – $22,342 |
| New Hampshire | $63,820 | 1.098 | $14,821 | $10,057 – $23,819 |
| New Jersey | $74,380 | 1.279 | $16,346 | $11,092 – $26,271 |
| New Mexico | $47,980 | 0.825 | $12,532 | $8,504 – $20,141 |
| New York | $69,350 | 1.193 | $15,620 | $10,599 – $25,103 |
| North Carolina | $50,030 | 0.861 | $12,828 | $8,705 – $20,617 |
| North Dakota | $60,540 | 1.041 | $14,347 | $9,735 – $23,057 |
| Ohio | $55,670 | 0.958 | $13,643 | $9,258 – $21,926 |
| Oklahoma | $49,120 | 0.845 | $12,697 | $8,616 – $20,406 |
| Oregon | $61,510 | 1.058 | $14,487 | $9,830 – $23,283 |
| Pennsylvania | $56,470 | 0.971 | $13,759 | $9,336 – $22,112 |
| Rhode Island | $63,580 | 1.094 | $14,786 | $10,033 – $23,763 |
| South Carolina | $50,180 | 0.863 | $12,850 | $8,720 – $20,652 |
| South Dakota | $46,980 | 0.808 | $12,388 | $8,406 – $19,909 |
| Tennessee | $46,740 | 0.804 | $12,353 | $8,382 – $19,853 |
| Texas | $47,200 | 0.812 | $12,419 | $8,427 – $19,960 |
| Utah | $51,580 | 0.887 | $13,052 | $8,857 – $20,977 |
| Vermont | $56,330 | 0.969 | $13,738 | $9,323 – $22,080 |
| Virginia | $51,520 | 0.886 | $13,044 | $8,851 – $20,963 |
| Washington | $68,870 | 1.185 | $15,550 | $10,552 – $24,991 |
| West Virginia | $51,080 | 0.879 | $12,980 | $8,808 – $20,861 |
| Wisconsin | $58,060 | 0.999 | $13,988 | $9,492 – $22,481 |
| Wyoming | $49,680 | 0.854 | $12,778 | $8,671 – $20,536 |
The finding that surprised me
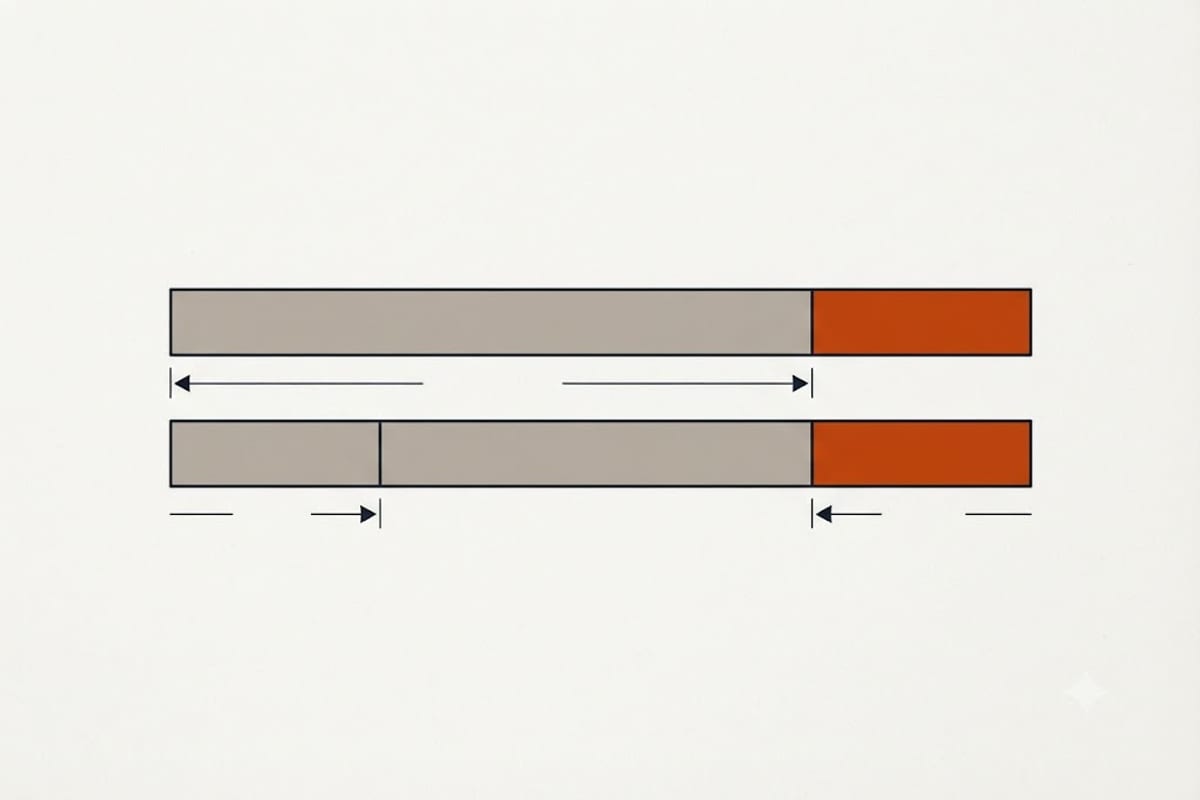
The spread is 1.39×, not 3×. Illinois at $16,819 against Mississippi at $12,142 — a $4,677 gap on a $14,000 job. Roofer pay itself varies by 53% top to bottom, but it only lands on 60% of the bill, so the total compresses.
That matters because it kills a common assumption. People in expensive states brace for a number twice the national figure, and people in cheap states expect to be well under it. Neither happens. Almost every state sits within about 20% of $14,000 for this roof, and the difference between a good bid and a bad bid in your own town is larger than the difference between your state and the next one.
Note also who is at the top. Not California, not New York — Illinois, New Jersey, Massachusetts and Minnesota. Roofing is unionized and seasonal in the upper Midwest and the Northeast, and a short working season prices into the wage.
What the wage number does not capture
The table is honest about one thing and silent about three others.
Code requirements. These vary by jurisdiction, not by state line, but they cluster geographically:
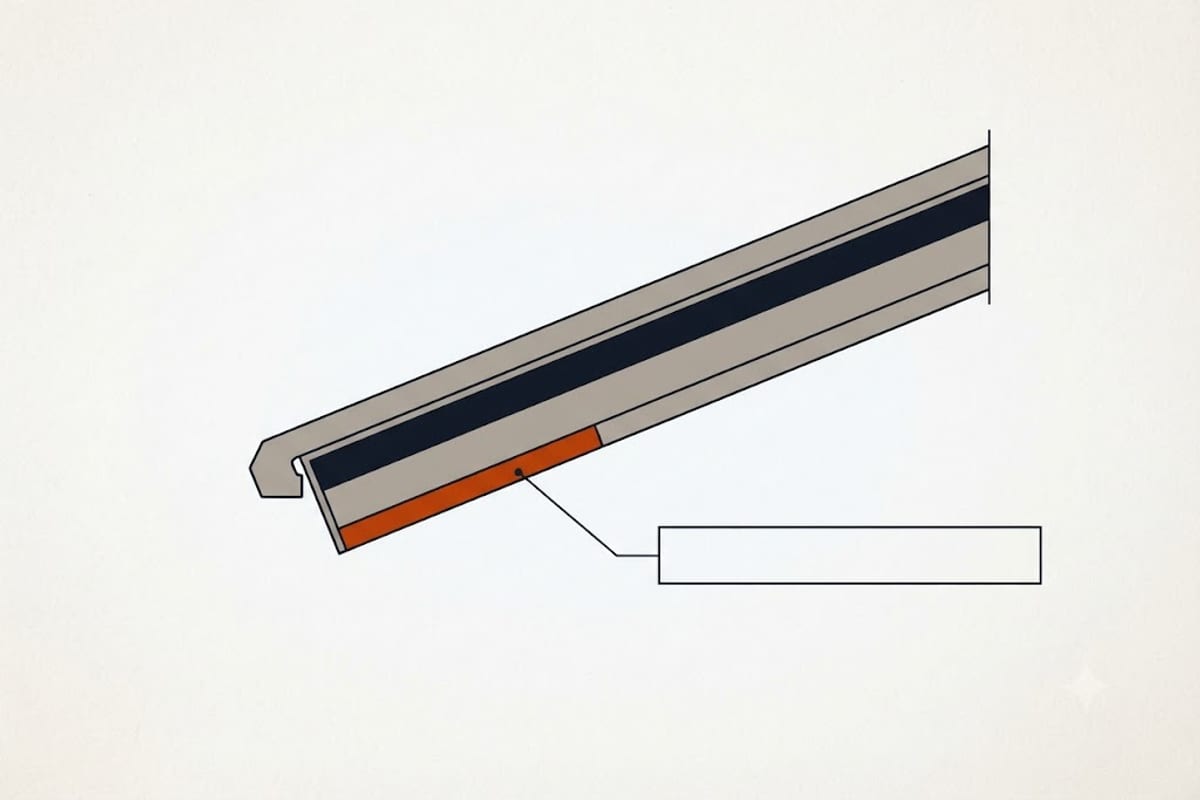
- Northern states require an ice barrier at the eaves — typically the first 24 inches inside the warm wall. That is a material and labor line the South does not have. See ice and water shield requirements.
- Florida and the coastal Gulf enforce high-wind fastening — six nails per shingle instead of four, enhanced underlayment attachment, and in the HVHZ counties a permitted, inspected re-roof with specific product approvals. Florida's wage is low; its code adds back most of what the wage saves, and the table cannot see that.
- Hail country — Colorado, Nebraska, Kansas, north Texas, Oklahoma — has an insurance market so active that pricing there is partly set by claims rather than by homeowners.
Metro versus rural. Within a single state this gap routinely runs 25–40%. A state mean is the midpoint of a distribution most homeowners do not live at, and a state wage mean has the same problem.
Your own roof. Pitch, shape, stories and existing layers move a job further than geography does. A steep cut-up hip in a cheap state can cost more than a simple gable in an expensive one. See roof replacement cost per square for what those factors do.
Where geography genuinely changes the negotiation
Insurance-driven markets. In hail states, a large share of re-roofs are paid by claims. That changes the transaction entirely: the number that matters is the carrier's scope, not the contractor's list price, and a contractor who works claims daily is worth more than one who is cheapest.
High-wind zones. In coastal Florida and similar jurisdictions, a re-roof triggers a permit and an inspection, and the products have to carry the right approvals. A quote well under the local range is often a quote that skips that — a problem at sale time and a bigger one at claim time.
How to use this
Convert your house to squares first — see how many squares is my roof — then open your state's page above and set the real size. Treat the bid range as a plausibility check.
A quote below the range usually means something was left out of the scope rather than found cheaper, and on a re-roof the thing left out is normally decking replacement. Read the exclusions before you read the total.